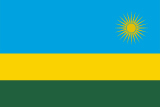
Rwanda
Rwanda: GDP 4.2K intl$ per capita, population 14.6M, inflation 5.9%. Compare economy, demographics and cost of living with other countries.
Location
Key Facts
Geography and Government
- Area
- 26,338 km²
- Capital
- Kigali
- ISO 2
- RW
- ISO 3
- RWA
- Calling code
- +250
- Internet TLD
- .rw
- Government type
- presidential republic
Age Structure
Languages
| Language | Type | Share | Speakers |
|---|---|---|---|
| English (ENG) | Official | - | - |
| French (FRA) | Official | - | - |
| Kinyarwanda (KIN) | Official | - | - |
Religions
| Religion | Type | Share | Adherents |
|---|---|---|---|
| Catholic | Minor | 39.9% | - |
| Pentecostal | Minor | 21.3% | - |
| Protestant | Minor | 14.6% | - |
| Adventist | Minor | 12.2% | - |
| Other Christians | Minor | 4.2% | - |
| No Religion | Minor | 3.0% | - |
| Muslim | Minor | 2.0% | - |
| Other Religions | Minor | 2.0% | - |
| Less Than | Minor | 1.0% | - |
Population & Demographics
Basic Demographics
Health Indicators
Education
Economy Snapshot
Key Economic Indicators
Macroeconomic Indicators
Trade & External Sector
Other Indicators
Explore More
Rankings featuring Rwanda
Frequently Asked Questions
What is the average income in Rwanda?
According to our data, the average income in Rwanda is approximately $1,150 (GNI per capita) as of 2025. This figure represents Gross National Income per capita and provides insight into the economic prosperity and living standards in the country.
What is the inflation rate in Rwanda in 2025?
The inflation rate in Rwanda is 5.9% as of 2025. Inflation measures the rate at which the general level of prices for goods and services rises, eroding purchasing power. This data is updated regularly from reliable sources like the World Bank and IMF.
How does Rwanda compare to other countries in Sub-Saharan Africa ?
Rwanda is located in Sub-Saharan Africa and can be compared with other countries in the region across various economic and demographic indicators including inflation rates, unemployment, average income, cost of living, population statistics, and life expectancy. Explore our comprehensive inflation comparison, unemployment rankings, cost of living data, population statistics, and life expectancy data to see how Rwanda compares to neighboring and regional countries.
Rwanda is located in Sub-Saharan Africa , Sub-Saharan Africa (excluding high income). Explore detailed statistics on economy, population, demographics, inflation, unemployment, and cost of living, with up-to-date data from the World Bank, IMF, UN, and other authoritative sources.
Our comprehensive database provides real-time insights into Rwanda's economic performance and demographic trends, allowing you to compare with other countries and understand global patterns. Access current economic indicators, population statistics, historical data, and comparative analysis to gain a deeper understanding of Rwanda's economic and demographic landscape. For detailed economic data, visit our economy page, and for demographic information, explore our population statistics section.
Sources and References
Data sources: World Bank, IMF, UN Data, Transparency International.
All data is compiled from publicly available sources and updated regularly. Economic indicators may vary based on reporting methodologies and data availability periods.
Codes and Abbreviations
- ISO 2
- RW
- ISO 3
- RWA
- IOC code
- RWA
- Vehicle code
- RWA
- Latitude
- -1.95
- Longitude
- 30.06